NextAnalytics blog on "Can a business intelligence product be used to answer analytic questions?" raised some valid questions on the complexity, the business users face while analyzing the business data. It did generate quite of few good responses on how MDX can provide the similar solution. I think both the approaches address different level of needs and both can co-exist.
I just started to look at their online demo site. Being in CPM (Corporate Performance Management) industry for about eight years, I can understand the difficulty the functional users face while venturing outside the realm of predefined reports and designing on their own.
I plan to write a multi-part articles on how NextAnalytics solutions can be replicated using MDX. I would be using "Adventure Works DW" OLAP database to replicate the similar business case.
I saw a very interesting case in NextAnalytics where the result grid cells distinct values can be swapped with either rows or columns as labels. The row or column members appear in against the swapped cell's. This is a very important and useful feature for performing the basket analysis or outliers in a report.
The goal is not to prove who is superior or complex to use. Just the sheer pleasure of validating that MDX is equally capable of fulfilling similar requirement.
Let me illustrate as what is happening in NextAnalytics' "Swap Cells with Row Labels" Feature:
1. This is the start point. The sales data is presented in the cross tab format. (a limited portion of data is displayed, hence in screens, they might not match)
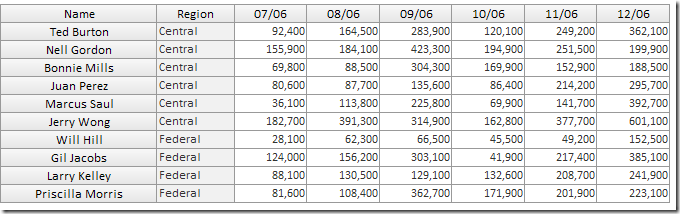
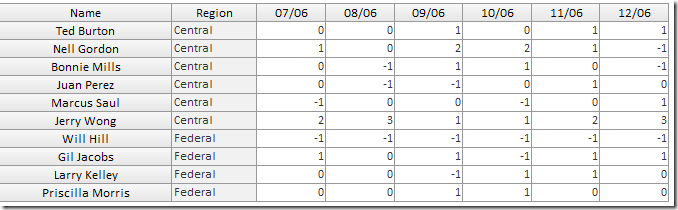
2. Now the variation of Sales data for each day and sales person (column-wise) is calculated and displayed. I guess, the formula would be somewhat at the below line:
Variation = (Sales Amount - Average) / (Standard Deviation for the day)
3. Using "Swap cells to Row Labels", the unique values of variation is shifted to rows and the row members are loaded in the corresponding standard deviation cells.
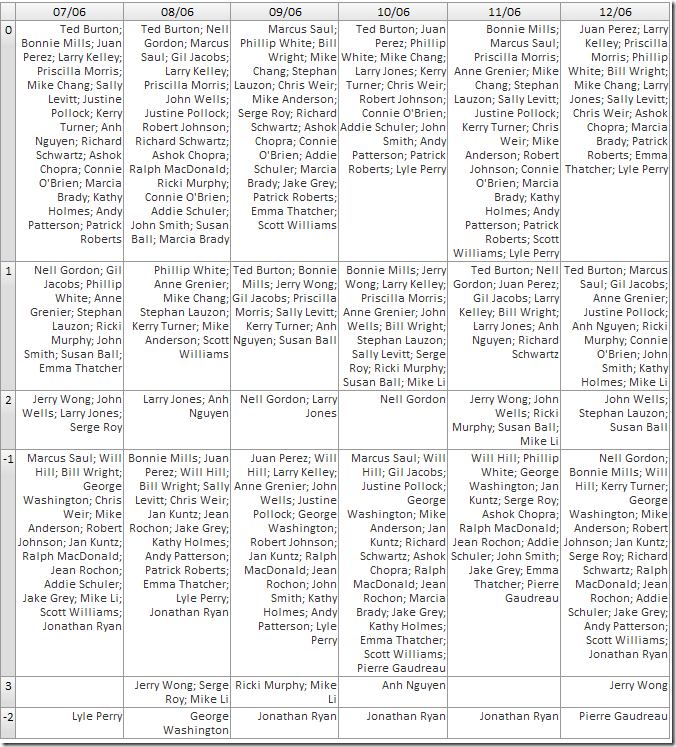
I would say that the above feature is simply awesome. I can visually say who are the "Outstanding" sales reps (Standard Deviation of more than 3) and who are the laggards (in above screen, standard deviation of -1) and whether they are consistent in their performance.
Challenge to replicate the same requirement using MDX:
1. Lets get some sample cross tab data
WITH
SET Emp AS
{
[Employee].[Employee].&[290]
,[Employee].[Employee].&[289]
,[Employee].[Employee].&[284]
,[Employee].[Employee].&[291]
,[Employee].[Employee].&[283]
,[Employee].[Employee].&[288]
,[Employee].[Employee].&[282]
,[Employee].[Employee].&[296]
,[Employee].[Employee].&[281]
,[Employee].[Employee].&[286]
,[Employee].[Employee].&[295]
,[Employee].[Employee].&[292]
,[Employee].[Employee].&[287]
,[Employee].[Employee].&[272]
,[Employee].[Employee].&[294]
,[Employee].[Employee].&[293]
,[Employee].[Employee].&[285]
}
SELECT
NON EMPTY
(EXISTING
{
[Date].[Date].&[915]
,[Date].[Date].&[946]
,[Date].[Date].&[975]
,[Date].[Date].&[1006]
,[Date].[Date].&[1036]
,[Date].[Date].&[1067]
}
*
[Reseller Sales Amount]
) ON COLUMNS
,NonEmpty(emp) ON ROWS
FROM [Adventure Works]
WHERE
[Date].[Calendar Year].&[2004]
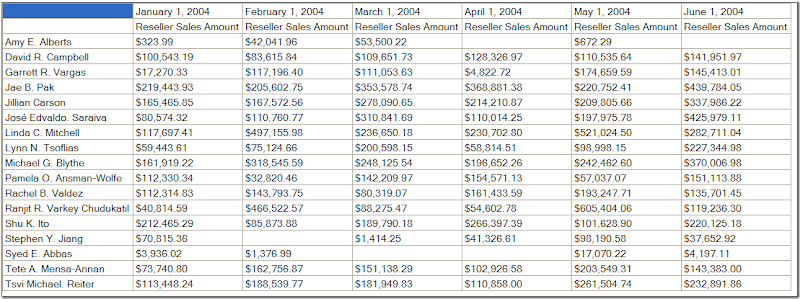
2. Now, lets calculate the variation. I would convert the variation amounts to the range basket so that we would have few but distinct variation baskets in the cell.
WITH
SET Emp AS
{
[Employee].[Employee].&[290]
,[Employee].[Employee].&[289]
,[Employee].[Employee].&[284]
,[Employee].[Employee].&[291]
,[Employee].[Employee].&[283]
,[Employee].[Employee].&[288]
,[Employee].[Employee].&[282]
,[Employee].[Employee].&[296]
,[Employee].[Employee].&[281]
,[Employee].[Employee].&[286]
,[Employee].[Employee].&[295]
,[Employee].[Employee].&[292]
,[Employee].[Employee].&[287]
,[Employee].[Employee].&[272]
,[Employee].[Employee].&[294]
,[Employee].[Employee].&[293]
,[Employee].[Employee].&[285]
}
MEMBER sales_avg AS
Avg
(
[Date].[Date].CurrentMember * [Emp]
,[Reseller Sales Amount]
)
MEMBER sales_StDev AS
StDev
(
[Date].[Date].CurrentMember * [Emp]
,[Reseller Sales Amount]
)
MEMBER Sales_Variation AS
([Reseller Sales Amount] - sales_avg) / sales_StDev
,format_string = "currency"
MEMBER Sales_Variation_Basket AS
CASE
WHEN
Sales_Variation > 3
THEN
3
WHEN
Sales_Variation > 2
THEN
2
WHEN
Sales_Variation > 1
THEN
1
WHEN
Sales_Variation > 0
THEN 0
WHEN
Sales_Variation > -1
THEN -1
WHEN
Sales_Variation > -2
THEN -2
WHEN
Sales_Variation > -3
THEN -3
END
SELECT
NonEmpty
(
(EXISTING
{
[Date].[Date].&[915]
,[Date].[Date].&[946]
,[Date].[Date].&[975]
,[Date].[Date].&[1006]
,[Date].[Date].&[1036]
,[Date].[Date].&[1067]
}
*
Sales_Variation_Basket
)
,NonEmpty(emp)
) ON COLUMNS
,NonEmpty(emp) ON ROWS
FROM [Adventure Works]
WHERE
[Date].[Calendar Year].&[2004]
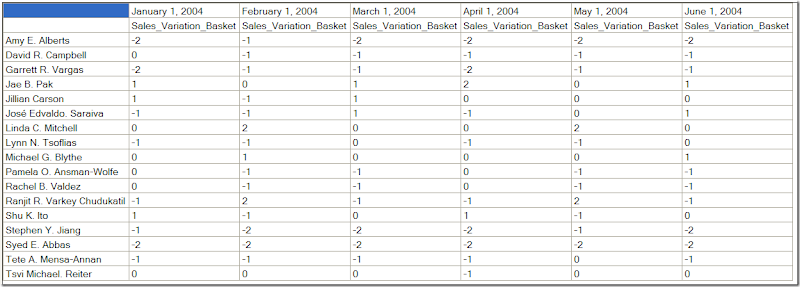
3. Now, we need to do "Cells to Row Labels" transformation on the above MDX. What i mean is to retain the dats on the column, put 3,2,1,0,-1,-2,-3 on rows and fill in the corresponding employees in the cells.
The result should be somewhat as below grid ( I have filled couple of cells manually for illustration).
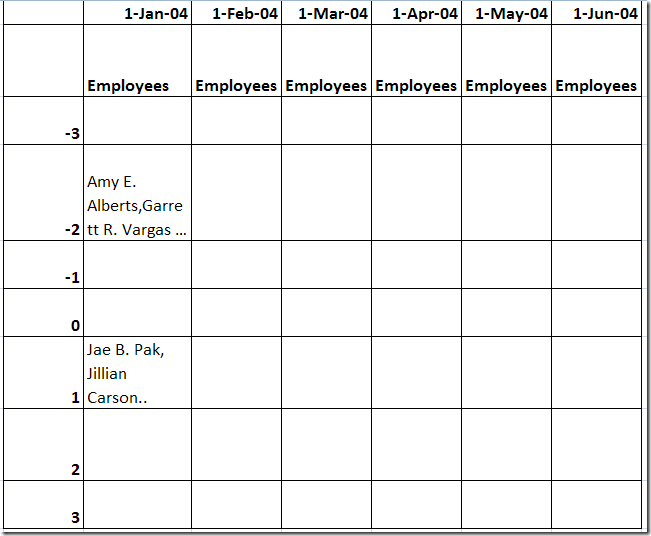
The MDX in item #1 and item#2 is for illustration of concept and not necessary the accuracy of calculation. The trick needed is to use the item#2 MDX and generate the last item#3 output.
Is anybody up for the challenge to write the third part of the MDX query?
Mosha provided the first cut of the query as below:
WITH
SET Emp AS
{
[Employee].[Employee].&[290]
,[Employee].[Employee].&[289]
,[Employee].[Employee].&[284]
,[Employee].[Employee].&[291]
,[Employee].[Employee].&[283]
,[Employee].[Employee].&[288]
,[Employee].[Employee].&[282]
,[Employee].[Employee].&[296]
,[Employee].[Employee].&[281]
,[Employee].[Employee].&[286]
,[Employee].[Employee].&[295]
,[Employee].[Employee].&[292]
,[Employee].[Employee].&[287]
,[Employee].[Employee].&[272]
,[Employee].[Employee].&[294]
,[Employee].[Employee].&[293]
,[Employee].[Employee].&[285]
}
MEMBER sales_avg AS
Avg
(
[Date].[Date].CurrentMember * [Emp]
,[Reseller Sales Amount]
)
MEMBER sales_StDev AS
StDev
(
[Date].[Date].CurrentMember * [Emp]
,[Reseller Sales Amount]
)
MEMBER Sales_Variation AS
([Reseller Sales Amount] - sales_avg) / sales_StDev
,format_string = "currency"
MEMBER Sales_Variation_Basket AS
CASE
WHEN
Sales_Variation > 3
THEN 3
WHEN
Sales_Variation > 2
THEN 2
WHEN
Sales_Variation > 1
THEN 1
WHEN
Sales_Variation > 0
THEN 0
WHEN
Sales_Variation > -1
THEN
-1
WHEN
Sales_Variation > -2
THEN
-2
WHEN
Sales_Variation > -3
THEN
-3
END
MEMBER Measures.[-2] AS
Generate
(
Filter
(
Emp
,
Sales_Variation_Basket = -2
)
,
Employee.Employee.CurrentMember.Name + ","
)
MEMBER Measures.[-1] AS
Generate
(
Filter
(
Emp
,
Sales_Variation_Basket = -1
)
,
Employee.Employee.CurrentMember.Name + ","
)
MEMBER Measures.[0] AS
Generate
(
Filter
(
Emp
,
Sales_Variation_Basket = 0
)
,
Employee.Employee.CurrentMember.Name + ","
)
MEMBER Measures.[1] AS
Generate
(
Filter
(
Emp
,
Sales_Variation_Basket = 1
)
,
Employee.Employee.CurrentMember.Name + ","
)
MEMBER Measures.[2] AS
Generate
(
Filter
(
Emp
,
Sales_Variation_Basket = 2
)
,
Employee.Employee.CurrentMember.Name + ","
)
SELECT
{
[Date].[Date].&[915]
,[Date].[Date].&[946]
,[Date].[Date].&[975]
,[Date].[Date].&[1006]
,[Date].[Date].&[1036]
,[Date].[Date].&[1067]
} ON COLUMNS
,{
Measures.[-2]
,Measures.[-1]
,Measures.[0]
,Measures.[1]
,Measures.[2]
} ON ROWS
FROM [Adventure Works]
And the output is as desired (partial screenshot):

While the above meets the requirement, there is one significant limitation that we need to overcome.
In the solution, the distinct values of "Sales_Variation_Basket" are manually defined as Measures.[3].....Measures.[-3].
We need to automate it. I mean, using MDX, to read the set of "Sales_Variation_Basket" values, read the distinct values out of it and sort it, and then put the distinct values of "Sales_Variation_Basket" on rows and then put the employees in the result cells.
I am sure we would have the solution soon.


 Posts
Posts


